Stack Overflow Mobile Questions Fell 95 to 99.5% Since 2022. The Whole Site Fell 99.1%
New Stack Overflow questions per quarter for SwiftUI, UIKit, Jetpack Compose, Kotlin Multiplatform, React Native and Flutter, Q1 2022 to Q3 2026. Method, script and limits included.
The earlier posts in this series used Hacker News and npm. This one counts questions. Stack Overflow has a public API that returns the number of new questions for any tag in any date range, so I pulled quarterly counts for six mobile tags, swiftui, uikit, jetpack-compose, kotlin-multiplatform, react-native and flutter, plus the site total as a control, from Q1 2022 to Q3 2026.
Every tag fell by 95% or more. So did the site: from 356,065 new questions in Q1 2022 to 3,160 in Q3 2026, a drop of 99.1%. The mobile tags did not escape it, so question volume stopped working as a popularity signal. What is left is the mix between them.
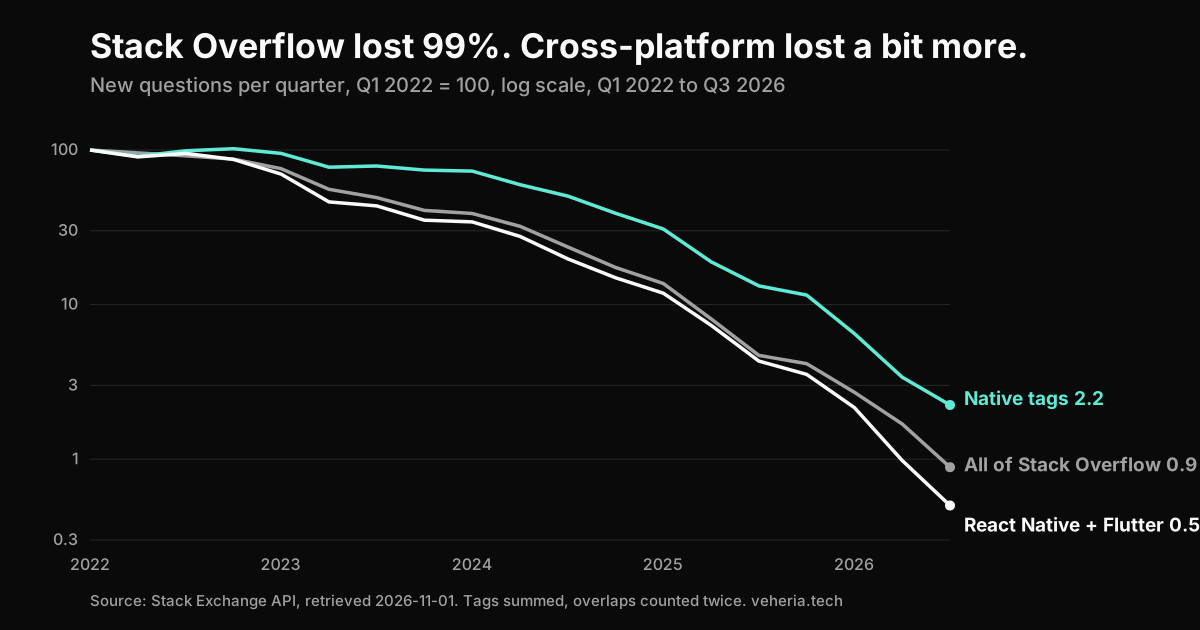
What the counts say
New questions per quarter, from the Stack Exchange API. “Native” is swiftui, uikit, jetpack-compose and kotlin-multiplatform added together. “Cross” is react-native and flutter added together. A question with two of these tags counts twice in the sums.
| Quarter | All SO | Native | Cross | Cross per native |
|---|---|---|---|---|
| 2022-Q1 | 356,065 | 3,482 | 16,740 | 4.81 |
| 2023-Q1 | 269,315 | 3,308 | 11,687 | 3.53 |
| 2024-Q1 | 138,199 | 2,543 | 5,737 | 2.26 |
| 2025-Q1 | 48,755 | 1,074 | 1,984 | 1.85 |
| 2026-Q1 | 9,642 | 226 | 361 | 1.60 |
| 2026-Q3 | 3,160 | 78 | 84 | 1.08 |
Per tag, first and last quarter:
| Tag | 2022-Q1 | 2026-Q3 | Change |
|---|---|---|---|
| flutter | 11,998 | 62 | -99.5% |
| react-native | 4,742 | 22 | -99.5% |
| swiftui | 2,195 | 43 | -98.0% |
| jetpack-compose | 898 | 22 | -97.6% |
| uikit | 281 | 8 | -97.2% |
| kotlin-multiplatform | 108 | 5 | -95.4% |
Three readings.
The whole site collapsed, so absolute counts measure Stack Overflow. The drop accelerated from 2023, with the steepest quarters in 2025 and 2026. I did not test why. A common explanation is that developers ask AI assistants first, but nothing in this data separates that from other causes, so I would not lean on it.
The cross-platform tags fell faster than the native tags. React Native and Flutter together lost 99.5%, the four native tags together lost 97.8%, the site lost 99.1%. In Q1 2022 there were 4.81 cross-platform questions per native question. In Q3 2026 there were 1.08, and the ratio went down in most quarters in between.
Share of the site shows it from the other side, on small counts. The native tags were 0.98% of all new questions in Q1 2022 and 2.47% in Q3 2026, with a high of 2.75% in Q3 2025. React Native and Flutter together went from 4.70% to 2.66%, but that share stayed between 3.9% and 4.9% through 2025 and fell only in 2026 (3.74%, 2.73%, 2.66%), where the counts are small. The ratio above is the steadier signal.
What this does and does not say
Fewer questions about a framework does not mean fewer people using it. Flutter lost the most volume partly because it had the most to lose: it was the biggest of the six tags by far. A framework that produces fewer questions per developer, because tooling or documentation got better, would also show a decline. The hiring counts and the npm installs measure other things and answer different questions, so none of the three settles which stack is winning.
Limits
- Counts are new questions with the tag at the time of the API call. Questions deleted later are not counted, so recent quarters may shrink in a later run as deletions catch up.
- The Q3 2026 counts are small (22 for
react-native, 5 forkotlin-multiplatform). A shift of a few questions moves a share noticeably. - Tags are chosen by the asker. Swift and Kotlin questions without a framework tag, and
ios,androidandswifttags, are not in the six. - Sums count a question once per matching tag, so the ratio is approximate.
- Stack Overflow is one source and its audience changed over the window.
- I ran the script twice and the two result sets were identical. Data retrieved 2026-11-01.
Method
import json, time, datetime as dt, urllib.request, gzip

TAGS = ['swiftui', 'uikit', 'jetpack-compose', 'react-native', 'flutter', 'kotlin-multiplatform', None]
API = 'https://api.stackexchange.com/2.3/questions?site=stackoverflow&filter=total&fromdate=%d&todate=%d'
ts = lambda y, m: int(dt.datetime(y, m, 1, tzinfo=dt.timezone.utc).timestamp())

def count(tag, a, b):
    url = API % (a, b - 1) + (f'&tagged={tag}' if tag else '')
    raw = urllib.request.urlopen(urllib.request.Request(url, headers={'Accept-Encoding': 'gzip'}), timeout=30).read()
    d = json.loads(gzip.decompress(raw))
    time.sleep(d.get('backoff', 0) + 0.3)
    return d['total']

for y in range(2022, 2027):
    for q in range(4):
        m = q * 3 + 1
        if (y, m) > (2026, 7): break
        a, b = ts(y, m), ts(y + (m + 3 > 12), (m + 3 - 1) % 12 + 1)
        print(y, q + 1, {(t or 'all'): count(t, a, b) for t in TAGS})
The API allows about 300 requests a day without a key, and this script makes about 133.
What I take from it
If you read a framework’s health from Stack Overflow questions, the signal is gone: everything fell by 95% or more. The one thing that still moves is the relative mix, and there native tags held their ground better than React Native and Flutter. What I did not measure: GitHub issues, Reddit, or how many questions now go to AI assistants instead. Where do you look for evidence when you pick a stack?